Managing IS Project
Managing the IS Project
Managing the Information Systems Project
Project?
* a planned undertaking of related activities to reach an objective that have a beginning and an end
Project management process
1. Initiating the project
2. Planning the project
3. Executing the project
4. Closing down the project
Initiating the project
1. Establishing the project initiation team
2. Establishing a relationship with the customer
3. Establishing the project initiation plan
4. Establishing management procedures
5. Establishing the project management and project workbook
Project Planning
1. Describing project scope, alternatives, and feasibility
2. Dividing the project into manageable tasks
3. Estimating resources and creating a resource plan
4. Developing a preliminary schedule
5. Developing a communication plan
6. Determining project standards and procedures
7. Identifying and assessing risk
8. Creating a preliminary budget
9. Developing a statement of work
10. Setting a baseline project plan
Representing and Scheduling Project Plans
- Representing Project Plans
- PERT and Gantt Chart
- Using project management software
- Microsoft Project
- Primavera, KickStart etc
PERT vs. Gantt
All us to show dependencies explicitly
Allow us to calculate critical path
Can tell us how one task filling behind affects other tasks
Allow us to record progress of project
Allow us to see what tasks are falling behind
Allow us to represent overlapping tasks
Project Management Tools
An example is MS Project
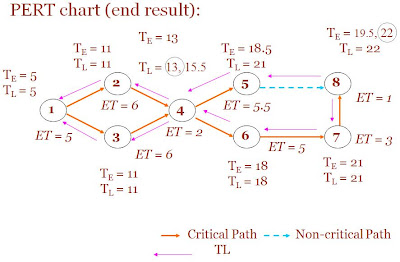
PERT CHART
PERT CHART - the making
Steps:
1. Identify each activity to be completed in the project
2. Determine:
- a. Optimistic time (o) - min
b. Realistic time (r) - “best guess”
c. Pessimistic time (p) - max
d. Calculate ET:
- ET = o + 4r + p
- 6
 3. Determine the sequence of the activities and precedence relationships among all activities
Example :


4. Determine the critical path(CP)
* CP - delay in completion of an activity will result in delaying the entire project
* slack time - the amount of time that an activity can be delayed without delaying the project
* calculate TE (sum of the ET for each activity from LR)
* calculate TL (time an activity can be completed without delaying the project - RL)
** CP = activities slack time equals to zero

1 comments:
hello sir
i want PERT chart for my project "wireless notice board using WiFi"
please help me sir.
Post a Comment